R: ggplot2: scale_manual その3 [統計]
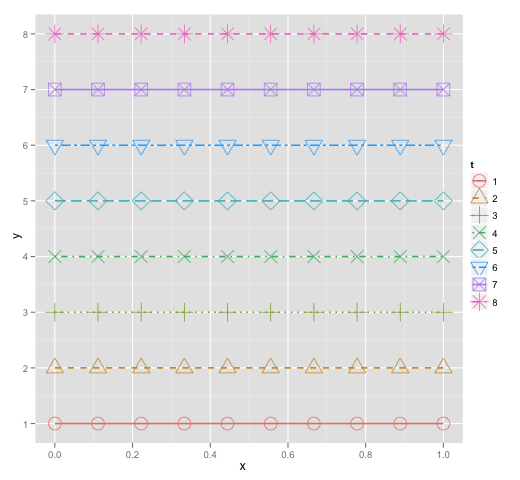
scale_linetype_manual()とscale_shape_manual()。
コード
コード
library(ggplot2)

n <- 10
m <- 8
x <- rep(seq(0, 1, len = n), m)
t <- rep(seq(1, m), each = n)
y <- t
d <- data.frame(x = x, y = y, t = as.factor(t))

p4 <- ggplot(d, aes(x = x, y = y, group = t)) +
      xlim(0, 1) +
      geom_line(aes(linetype = t, colour = t),
                size = 0.75, alpha = 1) +
      scale_linetype_manual(values = 1:m) +
      geom_point(aes(shape = t, colour = t),
                 size = 6, alpha = 1) +
      scale_shape_manual(values = 1:m)
png("Rplot004.png", width = 520, height = 480)
print(p4)
dev.off()


コメント 0