R: ggplot2: scale_manual その2 [統計]
scale_manual系のつづき。
コード
コード
library(ggplot2)
set.seed(123)
n <- 100
x <- runif(n, 0, 1)
y <- runif(n, 0, 1)
z <- runif(n, 0, 1)
c <- ifelse(z < 0.5, 1, 2)
d <- data.frame(x = x, y = y, z = z, c = as.factor(c))
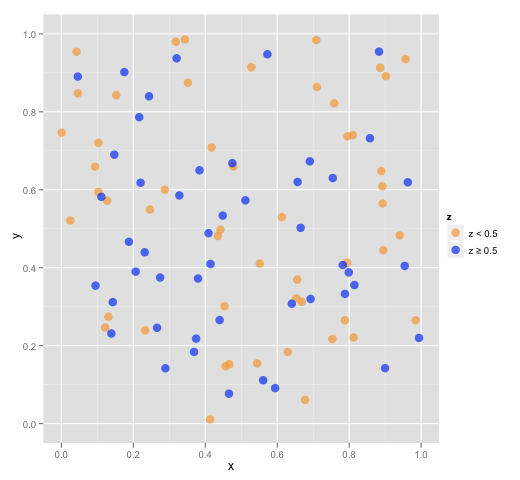
p2 <- ggplot(d) +
geom_point(aes(x = x, y = y, colour = c),
size = 4, alpha = 0.67) +
scale_colour_manual(name = "z",
breaks = c(1, 2),
values = c("orange", "blue"),
labels = c("z < 0.5", "z ≥ 0.5")) +
xlim(0, 1) + ylim(0, 1)
png("Rplot002.png", width = 520, height = 480)
print(p2)
dev.off()
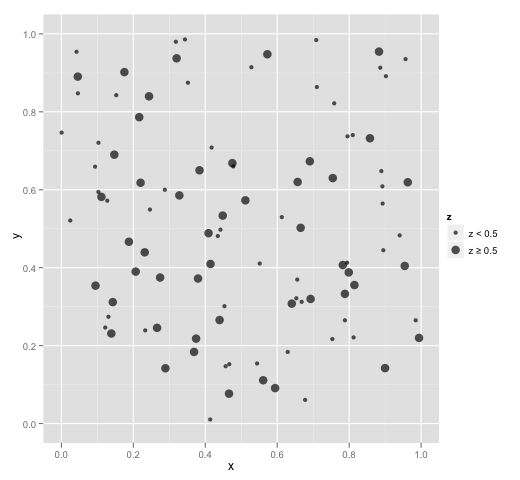
p3 <- ggplot(d) +
geom_point(aes(x = x, y = y, size = c),
alpha = 0.67) +
scale_size_manual(name = "z",
breaks = c(1, 2),
values = c(2, 4),
labels = c("z < 0.5", "z ≥ 0.5")) +
xlim(0, 1) + ylim(0, 1)
png("Rplot003.png", width = 520, height = 480)
print(p3)
dev.off()


コメント 0