R: Boosted Regression Treesをためしてみるテスト [統計]
森林学会で南光さんが使っていたBoosted Regression Treesをためしたみたメモ。
gbmパッケージを使用。
> library(gbm)
データには毎度おなじみirisを使用。
> data(iris)
実行。
> fit <- gbm(Species ~ Sepal.Length + Sepal.Width + Petal.Length + Petal.Width,
+            data = iris, distribution = "multinomial", n.trees = 4000)
結果。グラフも表示される。
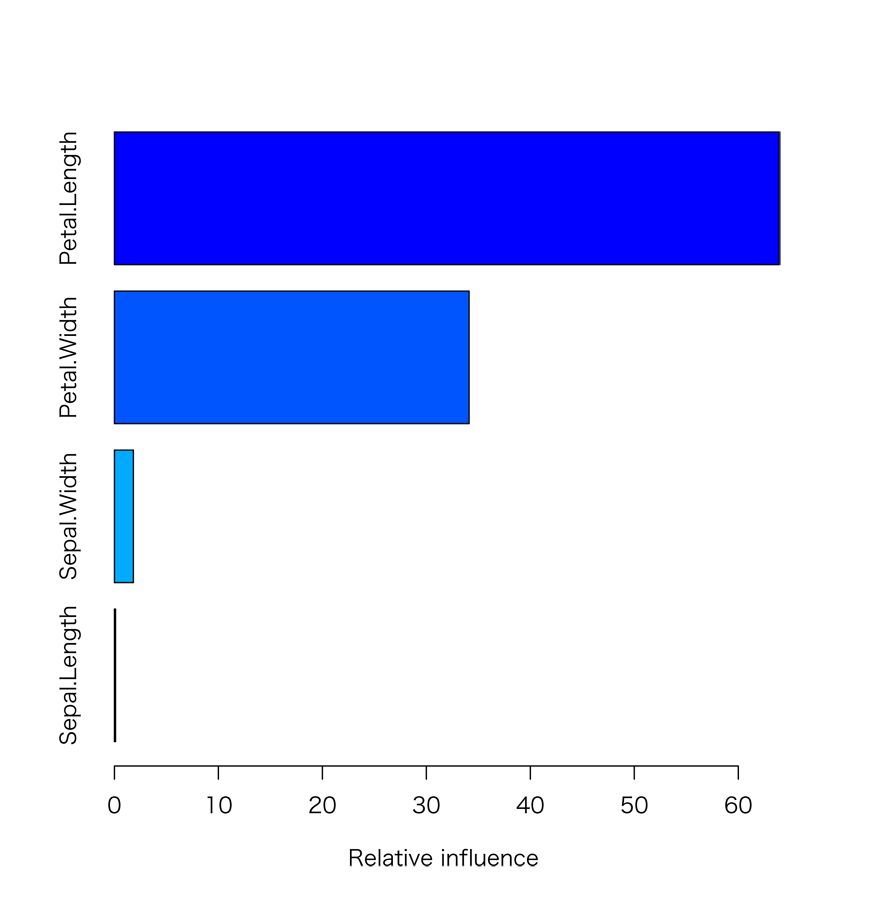
> summary(fit)
                      var    rel.inf
Petal.Length Petal.Length 63.9404419
Petal.Width   Petal.Width 34.1165913
Sepal.Width   Sepal.Width  1.8287997
Sepal.Length Sepal.Length  0.1141671
Performance
> gbm.perf(fit, method = "OOB")
[1] 2645
警告メッセージ:
In gbm.perf(fit, method = "OOB") :
OOB generally underestimates the optimal number of iterations although predictive performance is reasonably competitive. Using cv.folds>0 when calling gbm usually results in improved predictive performance.
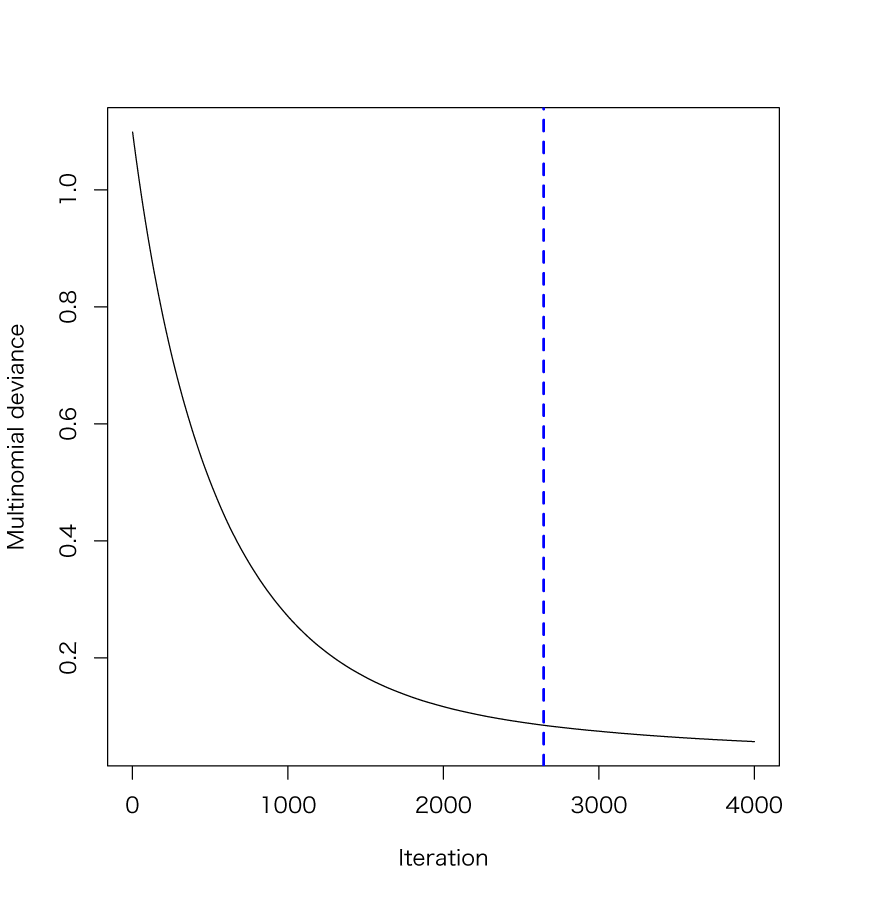
たしかに2645回くらいではすくないような気がする。
Tree component
> pretty.gbm.tree(fit)
  SplitVar SplitCodePred LeftNode RightNode MissingNode ErrorReduction Weight Prediction
0        2       2.50000        1         2           3       16.98667     75    0.00006
1       -1       0.00300       -1        -1          -1        0.00000     26    0.00300
2       -1      -0.00150       -1        -1          -1        0.00000     49   -0.00150
3       -1       0.00006       -1        -1          -1        0.00000     75    0.00006
正直、まだ理解できていないところがおおい。
タグ:R


コメント 0