R: ggplot2のグラフを配置する [統計]
ggplot2のグラフを、標準グラフィックのpar(mfrow = c(a, b))風に配置するには、gridExtraパッケージを使用する、とメモ。
library(ggplot2)
library(gridExtra)
x <- c(0, 1, 2, 3, 4, 5, 6, 7, 8, 9)
y <- c(1, 3, 4, 4, 6, 5, 4, 8, 9, 8)
z <- c(1, 2, 2, 1, 3, 2, 1, 4, 2, 3)
p <- ggplot(data.frame(x, y, z))
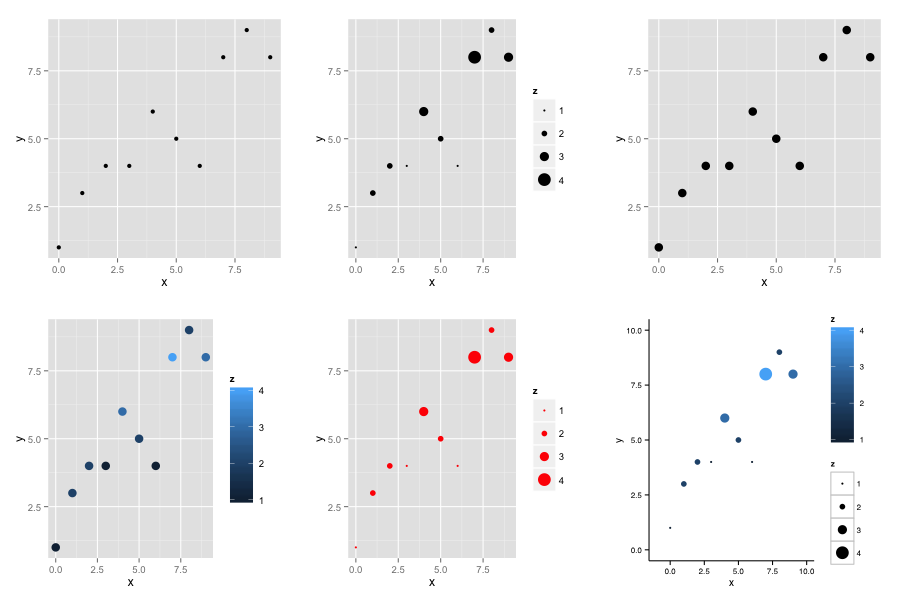
p1 <- p + geom_point(aes(x = x, y = y))
p2 <- p + geom_point(aes(x = x, y = y, size = z))
p3 <- p + geom_point(aes(x = x, y = y), size = 4)
p4 <- p + geom_point(aes(x = x, y = y, colour = z), size = 4)
p5 <- p + geom_point(aes(x = x, y = y, size = z), colour = "red")
p6 <- p + geom_point(aes(x = x, y = y, color = z, size = z)) +
theme_classic(10, "Helvetica") + xlim(-1, 10) + ylim(0, 10)
grid.arrange(p1, p2, p3, p4, p5, p6, ncol = 3, nrow = 2)
結果


コメント 0