R: ggplot2: facet_grid() [統計]
今度はfacet_grid()で。
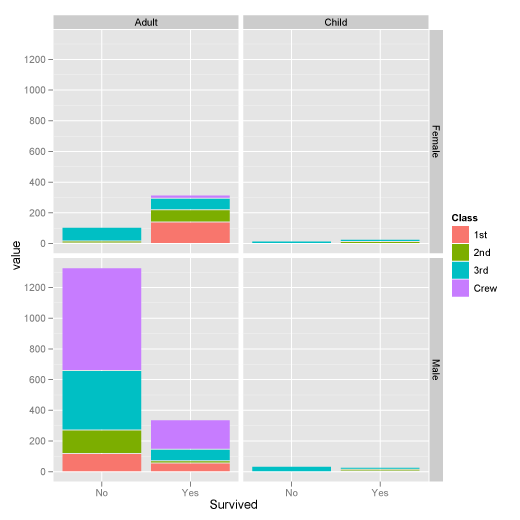
library(ggplot2)

data(Titanic)

titanic.m <- melt(Titanic)
p <- ggplot(titanic.m, aes(x = Survived, y = value, fill = Class)) +
  geom_bar() + facet_grid(Sex ~ Age)


コメント 0