R: 最近接距離のモンテカルロ [統計]
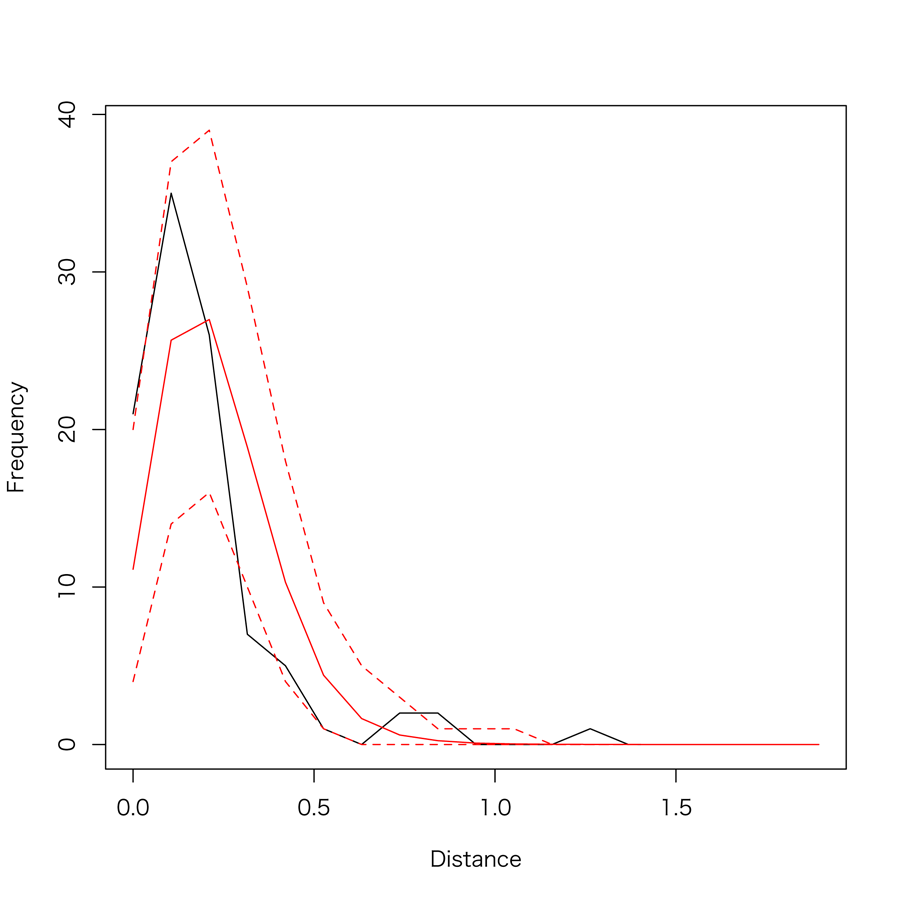
ランダム分布を仮定したときの最近接距離の誤差推定をモンテカルロでやってみる。
コード
結果

コード
## Monte-Carlo
library(boot)
library(sp)

set.seed(1234)

# data generation
n <- 100

p.x <- rnorm(n, 0, 1)
p.y <- rnorm(n, 0, 1)
p <- SpatialPoints(data.frame(x = p.x, y = p.y))

max.dist <- max(spDists(p))
br <- seq(0, floor(max.dist / 4 + 1), length = 20)
n.dist <- sapply(1:length(p), function(i) min(spDistsN1(p[-i], p[i])))
dist <- hist(n.dist, right = FALSE, plot = FALSE, breaks = br)$counts


# Monte-Carlo
n.iter <- 2000

mc.func <- function(d, box, breaks) {
	n <- NA
	if (class(d) == "SpatialPoints") {
		n <- length(p)
	} else if (class(d) == "data.frame" | class(d) == "matrix") {
		n <- nrow(d)
	} else {
		stop("invalid data.")
	}
	x <- runif(n, box[1, 1], box[1, 2])
	y <- runif(n, box[2, 1], box[2, 2])

	p <- SpatialPoints(data.frame(x = x, y = y))
	n.dist <- sapply(1:length(p), function(i) min(spDistsN1(p[-i], p[i])))
	hist(n.dist, right = FALSE, plot = FALSE, breaks = breaks)$counts
}

boot1 <- boot(p, mc.func, n.iter,
              sim = "parametric", box = p@bbox, breaks = br)
m <- sapply(1:(length(br) -1),
		function(i) mean(boot1$t[, i]))
ci <- sapply(1:(length(br) -1),
		function(i) quantile(boot1$t[, i], probs = c(0.025, 0.975)))

x <- br[1:(length(br) - 1)]
plot(x, ci[2, ], type = "n",
     xlab = "Distance", ylab = "Frequency")
lines(x, dist)
lines(x, m, col = 2)
lines(x, ci[1, ], col = 2, lty = 2)
lines(br[1:(length(br) - 1)], ci[2, ], col = 2, lty = 2)
結果
タグ:R


コメント 0