R: ggplot2で凡例の横幅を調整する [統計]
ggplot2でこまかな調整をするにはopts()関数をつかう、とメモ。
結果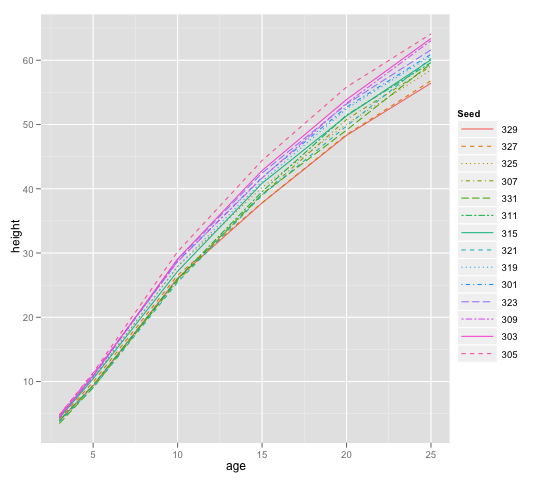
library(ggplot2)
data(Loblolly)
p <- ggplot(data = Loblolly, aes(x = age, y = height))
p1 <- p + geom_line(aes(colour = Seed, linetype = Seed)) +
          scale_linetype_manual(values = 1:length(levels(Loblolly$Seed))) +
          opts(legend.key.width = unit(40, "points"))
png("Rplot.png", width = 540, height = 480)
print(p1)
dev.off()
結果


コメント 0