R: ggplot2でIPAフォント使用 [統計]
ggplot2でIPAフォントをつかってみた。
参考にしたところ
参考にしたところ
library(ggplot2)
mytheme_bw <- function (base_size = 12, family = "") {
structure(list(
axis.line = theme_blank(),
axis.text.x = theme_text(family = family, size = base_size * 0.8,
lineheight = 0.9, vjust = 1),
axis.text.y = theme_text(family = family, size = base_size * 0.8,
lineheight = 0.9, hjust = 1),
axis.ticks = theme_segment(colour = "black", size = 0.2),
axis.title.x = theme_text(family = family, size = base_size, vjust = 0),
axis.title.y = theme_text(family = family, size = base_size, angle = 90,
vjust = 0.5),
axis.ticks.length = unit(0.3, "lines"),
axis.ticks.margin = unit(0.5, "lines"),
legend.background = theme_rect(colour = NA),
legend.key = theme_rect(colour = "grey80"),
legend.key.size = unit(1.2, "lines"),
legend.text = theme_text(family = family, size = base_size * 0.8),
legend.title = theme_text(family = family, size = base_size * 0.8,
face = "bold", hjust = 0),
legend.position = "right",
panel.background = theme_rect(fill = "white", colour = NA),
panel.border = theme_rect(fill = NA, colour = "grey50"),
panel.grid.major = theme_line(colour = "grey90", size = 0.2),
panel.grid.minor = theme_line(colour = "grey98", size = 0.5),
panel.margin = unit(0.25, "lines"),
strip.background = theme_rect(fill = "grey80", colour = "grey50"),
strip.text.x = theme_text(family = family, size = base_size * 0.8),
strip.text.y = theme_text(family = family, size = base_size * 0.8,
angle = -90),
plot.background = theme_rect(colour = NA),
plot.title = theme_text(family = family, size = base_size * 1.2),
plot.margin = unit(c(1, 1, 0.5, 0.5), "lines")), class = "options")
}
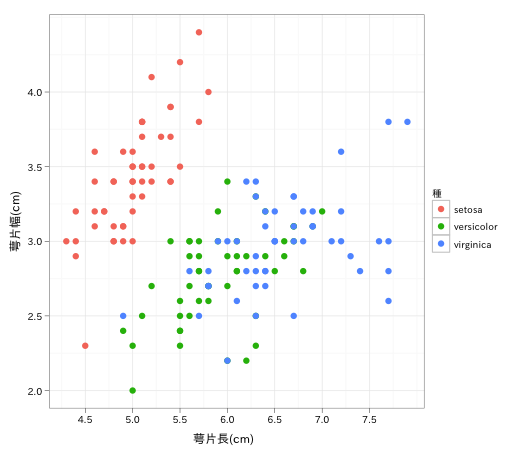
data(iris)
iris$種 <- iris$Species
p <- ggplot(data = iris, aes(x = Sepal.Length, y = Sepal.Width,
colour = 種))
p1 <- p + geom_point(size = 3) + xlab("萼片長(cm)") + ylab("萼片幅(cm)")
p.ipa <- p1 + mytheme_bw(family = "IPAexGothic")
png("Rplot.png", width = 520, height = 450)
print(p.ipa)
dev.off()


コメント 0