R: Sweave [統計]
この前のRユーザー会で覚えたわざ。Sweaveで文芸的プログラミング。
Leisch, Friedrich (2002) Sweave, part I: Mixing R and Latex. R News, 2(3):28-31. から例題。
example.Snw
Rコンソールにて
アウトプット
Leisch, Friedrich (2002) Sweave, part I: Mixing R and Latex. R News, 2(3):28-31. から例題。
example.Snw
\documentclass[a4paper]{article}
\begin{document}
<<echo=false,results=hide>>=
library(lattice)
library(xtable)
data(cats, package = "MASS")
@
\section*{The Cats Data}
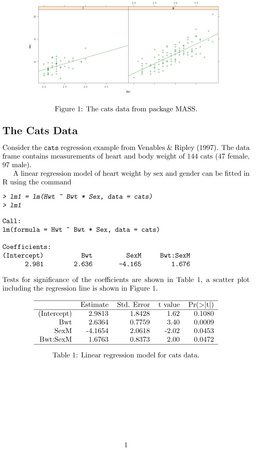
Consider the \texttt{cats} regression example from Venables \&
Ripley (1997). The data frame contains measurements of heart
and body weight of \Sexpr{nrow(cats)} cats
(\Sexpr{sum(cats$Sex == "F")} female,
\Sexpr{sum(cats$Sex == "M")} male).
A linear regression model of heart weight by sex and gender
can be fitted in R using the command
<<>>=
lm1 = lm(Hwt ~ Bwt * Sex, data = cats)
lm1
@
Tests for significance of the coefficients are shown in
Table~\ref{tab:coef}, a scatter plot including the regression
line is shown in Figure~\ref{fig:cats}.
\SweaveOpts{echo=false}
<<results=tex>>=
xtable(lm1, caption = "Linear regression model for cats data.",
label = "tab:coef")
@
\begin{figure}
\centering
<<fig=true,width=12,height=6>>=
trellis.par.set(theme = col.whitebg())
print(xyplot(Hwt ~ Bwt|Sex, data = cats, type = c("p", "r")))
@
\caption{The cats data from package MASS.}
\label{fig:cats}
\end{figure}
\end{document}
Rコンソールにて
> Sweave("example.Snw")
> system("pdflatex example.tex")
> system("pdflatex example.tex")
アウトプット

2010-11-30 20:16
nice!(0)
コメント(0)
トラックバック(0)


コメント 0