R: lmodel2 その2 [統計]
前回から もうちょっと調べてみる。
さて、lmodel2()のRMAはRanged Major Axisで、SMA (Standard Major Axis)がReduced Major Axisと同じものである、ということには実は前回は気がついていなかった。で、Model II 回帰については飯島さんがくわしく書いておられたのであった。
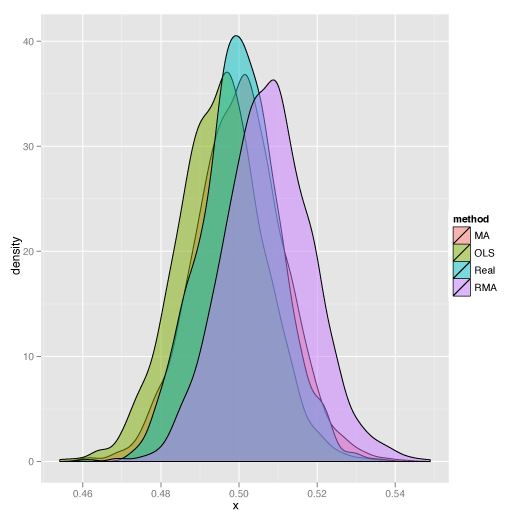
まずはこういうデータで試してみる。
結果
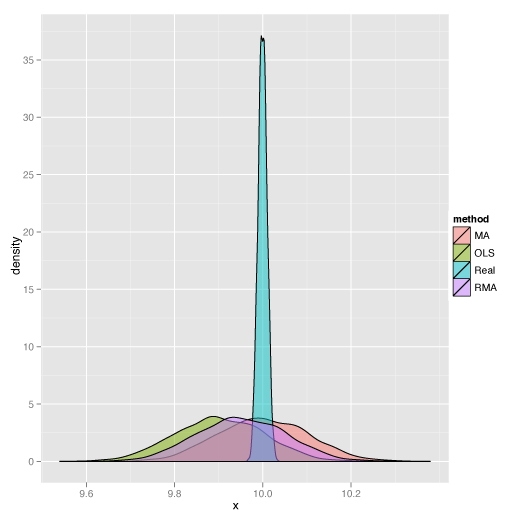
では、こういうデータでは。
こうなる。
さて、lmodel2()のRMAはRanged Major Axisで、SMA (Standard Major Axis)がReduced Major Axisと同じものである、ということには実は前回は気がついていなかった。で、Model II 回帰については飯島さんがくわしく書いておられたのであった。
まずはこういうデータで試してみる。
###
###
library(lmodel2)

## data
set.seed(1234)

test1 <- function(beta = 0, beta.x = 0.5,
                  n = 100,
                  sd.x = 0.1, sd.y = 0.1) {
  x0 <- rnorm(n, 0, 1)
  x <- x0 + rnorm(n, 0, sd.x)
  y <- beta + beta.x * x0 + rnorm(n, 0, sd.y)
  c0 <- lm(y ~ x0)$coefficients["x0"]
  suppressMessages(m <- lmodel2(y ~ x))
  ## inclination in OLS
  c.ols <- m$regression.result[1, 3]
  ## inclination in MA
  c.ma <- m$regression.result[2, 3]
  ## in SMA = Reduced Major Axis
  c.sma <- m$regression.result[3, 3]
  c(c0, c.ols, c.ma, c.sma)
}

ma1 <- replicate(2000, test1(beta = 0, beta.x = 0.5,
                             n = 100,
                             sd.x = 0.1, sd.y = 0.1))

save(ma1, file = "ma1.RData")

library(ggplot2)

v.ma1 <- c(t(ma1))
v.mtd <- rep(c("Real", "OLS", "MA", "RMA"), each = ncol(ma1))
d.ma1 <- data.frame(x = v.ma1, method = v.mtd)
p.ma1 <- ggplot(data = d.ma1, aes(x = x))
p.ma1 <- p.ma1 + geom_density(aes(fill = method), alpha = 0.5)

pdf("ma1.pdf", width = 520/72, height = 520/72,
    family = "Helvetica", pointsize = 12)
print(p.ma1)
dev.off()
結果
では、こういうデータでは。
##
## 2
##
ma2 <- replicate(2000, test1(beta = 0, beta.x = 10,
                             n = 100,
                             sd.x = 0.1, sd.y = 0.1))

save(ma2, file = "ma2.RData")

v.ma2 <- c(t(ma2))
v.mtd <- rep(c("Real", "OLS", "MA", "RMA"), each = ncol(ma2))
d.ma2 <- data.frame(x = v.ma2, method = v.mtd)
p.ma2 <- ggplot(data = d.ma2, aes(x = x))
p.ma2 <- p.ma2 + geom_density(aes(fill = method), alpha = 0.5)

pdf("ma2.pdf", width = 520/72, height = 520/72,
    family = "Helvetica", pointsize = 12)
print(p.ma2)
dev.off()
こうなる。
タグ:R


コメント 0