R: geom_point()での点の大きさと色の指定 [統計]
ggplot2のメモ。点の大きさと色をかえる。
library(ggplot2)

x <- c(0, 1, 2, 3, 4, 5, 6, 7, 8, 9)
y <- c(1, 3, 4, 4, 6, 5, 4, 8, 9, 8)
z <- c(1, 2, 2, 1, 3, 2, 1, 4, 2, 3)

p <- ggplot(data.frame(x, y, z))
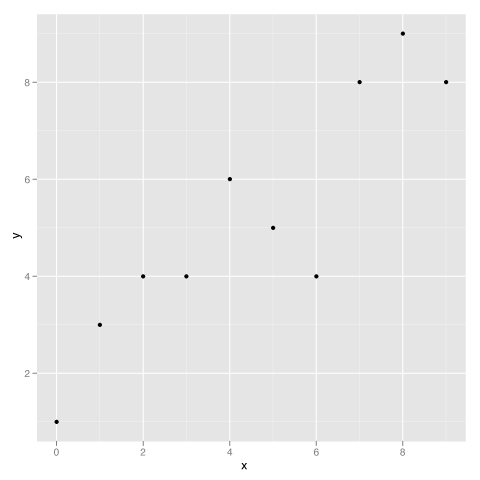
まずはふつうにプロット。
p + geom_point(aes(x = x, y = y))
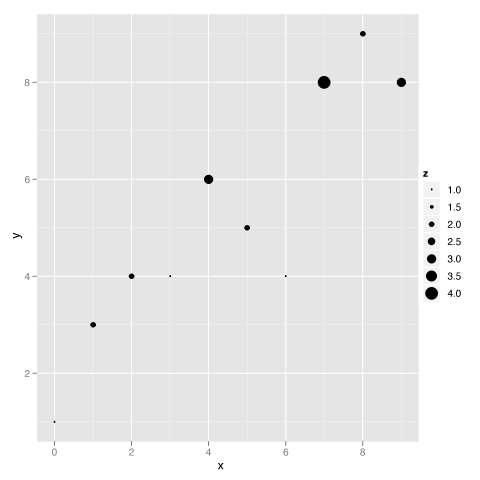
点の大きさをzに応じてかえる。aes()中のsize引数で指定する。
p + geom_point(aes(x = x, y = y, size = z))
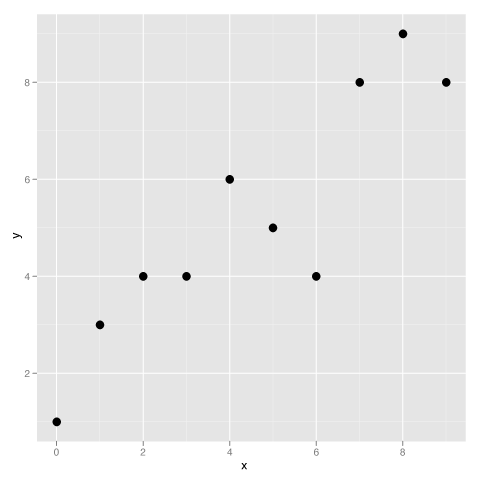
点の大きさを4にする。geom_point()のsize引数で指定する。
p + geom_point(aes(x = x, y = y), size = 4)
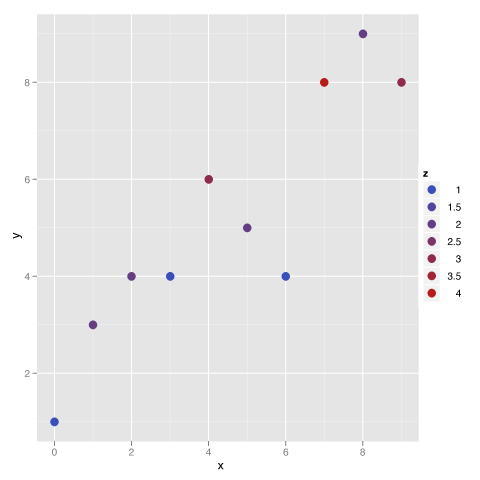
点の色をzで かえ、大きさを4にする。
p + geom_point(aes(x = x, y = y, colour = z), size = 4)
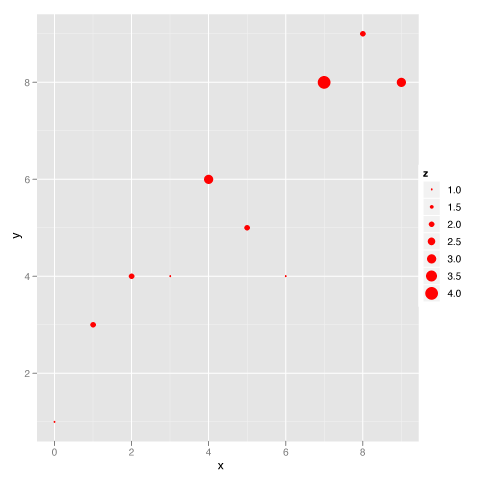
点の大きさをzで かえ、色を赤にする。
p + geom_point(aes(x = x, y = y, size = z), colour = "red")
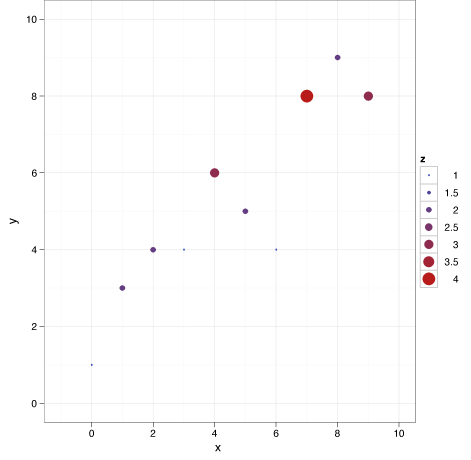
点の大きさと色をzで かえる。そのほか表示を調整。
p + geom_point(aes(x = x, y = y, color = z, size = z)) +
  theme_bw() + xlim(-1, 10) + ylim(0, 10)


コメント 0